We're open 10 a.m.–3 p.m. on Thanksgiving! View all holiday hours
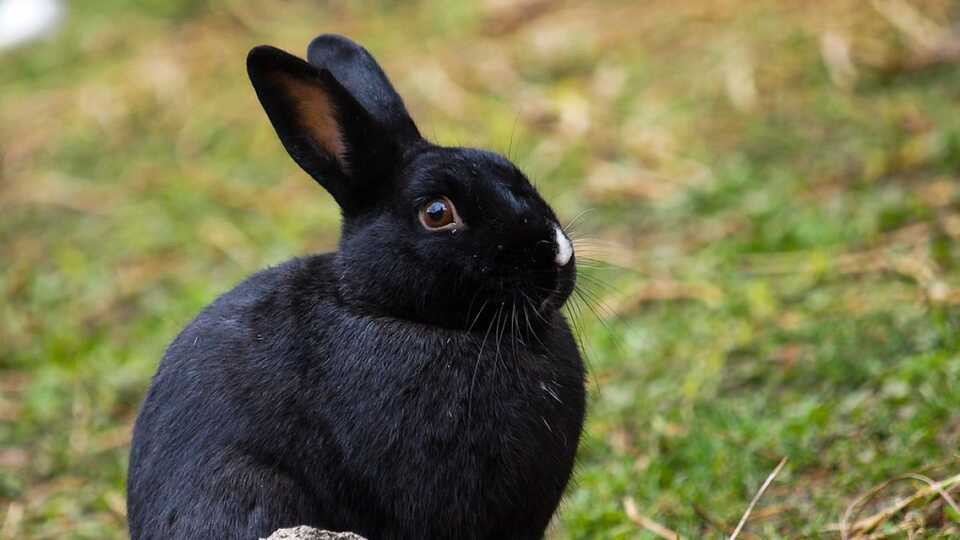
Image credit: ianmacd
0
In this classic activity, students trace allele frequencies in a population through many generations of bunnies.
Objectives
In this lesson, students will:
- learn that offspring inherit half of their genes from each parent.
- learn that different combinations of alleles result in different genotypes and phenotypes.
- trace allele frequencies in a population through many generations.
Materials
- white beans
- black beans
- cups
- pencils
- breeding bunnies worksheet (1 per student)
- counting areas worksheet (1 per group)
- Meet Mr. Bigglesworth article (to project, print, or share link with students)
Scientific Terms for Students
- DNA (deoxyribonucleic acid): the molecule that contains the genetic information that determines the traits of all living organisms
- gene: a segment of DNA, at a specific location on a chromosome, that is the basic unit of heredity
- allele: one of several forms of the same gene that codes for a particular trait
- allele frequency (also referred to as gene frequency): a measure of how common an allele is in a population
- dominant allele: an allele whose trait is expressed in the phenotype whenever that allele is present
- recessive allele: an allele whose trait is not expressed in the phenotype when the dominant allele is present
- inheritance: the process by which traits or characteristics pass from parents to offspring through the genes
- genotype: the genetic makeup of an organism as distinguished from its physical characteristics
- phenotype: the physical and functional characteristics of an organism as distinguished from its genetic makeup. The phenotype is the product of the genotype and environmental influences.
- homozygous: if an individual is homozygous for a particular gene, it has two copies of the same allele for that gene.
- heterozygous: if an individual is heterozygous for a particular gene, it has two different alleles for that gene.
- locus (plural: loci): a site on a chromosome occupied by a specific gene
- natural selection: the process by which organisms that are better adapted to their environment survive and reproduce at a higher rate than those that are less adapted, resulting in the survivors’ alleles and characteristics being more common in subsequent generations. Originally proposed by Charles Darwin, natural selection forms the basis of the process of evolution.
- evolution: change over time; descent with modification; changes in gene frequency in a population from one generation to the next (microevolution); descent of different species from a common ancestor over many generations (macroevolution)
Educator Prep
- Students may work in pairs or small groups. Print a Student Worksheet for each student to track the team's progress, and one Counting Area sheet for each team.
- At each team workstation, place one cup and one Counting Area sheet. Place one calculation worksheet for each student, so individuals can follow the directions and track progress themselves.
- Place 50 black beans and 50 white beans in each cup (or have your students help you count these out).
Introduction
Consider using the Meet Mr. Bigglesworth article to set the stage for the upcoming activity; project it for the class, print it out, or share the link with your students as pre-reading. This activity will use the fur/furless trait of rabbits to show some very important concepts of evolution.
As a class, discuss the following questions to review some basics of Mendelian genetics, inserting and defining some of the scientific terms for students, as appropriate:
- If f represents the recessive allele for furlessness and F represents the dominant allele for fur, what is the genotype of Mr. Bigglesworth, the furless rabbit? (ff)
- Imagine that Mr. Bigglesworth mated with a furred rabbit, and all of his first generation offspring had fur. What must be the genotype of these offspring? (Ff, as they must have received one dominant allele (F) from their mother in order to display a furry phenotype, and must have received one recessive allele (f) from their father, as that is the only type of allele he has available to give.)
- What was the likely genotype of the hypothetical rabbit Mr. Bigglesworth mated with? (If Mr. Bigglesworth’s mate had a genotype of Ff, some of the offspring would have, by chance, inherited the f allele and would therefore have been furless (ff). The genotype of his mate is most likely FF.)
- Now imagine that these offspring were bred with each other to produce Mr. Bigglesworth grandchildren. What are the possible genotypes of these grandchildren? (Draw and then fill in the Punnett square below.)
F f
F FF Ff
f Ff ff
Procedure
- Tell students that they will be playing a game called “breeding bunnies” that will enable them to examine the process of natural selection within a small population of rabbits. They will discover how allele frequencies can change in a population over successive generations when one of the alleles is lethal.
- Allow a few minutes for students to read the directions on the worksheet.
- Then, tell them to write down their hypothesis based on this question: How long do you think the allele for furlessness will persist in the rabbit population? Why?
- Now, they can proceed to play the game!
Game Directions
- The black beans represent the allele for fur (F) and the white beans represent the allele for no fur (f). The cup represents the English countryside, where the rabbits randomly mate. Please note that these initial frequencies (50% f and 50% F) have been chosen randomly for this activity.
- Place your hand over the cup and shake it. Pretend the rabbits are randomly mating. Note that this scenario is unrealistic in that the population does not actually increase with this pretend mating. However, the scenario does allow students to see random allele pairing and the subsequent changes in allele frequency. In the wrap-up section, you will see a full discussion of the ways in which this scenario is a good model, but does not perfectly mimic reality.
- Without looking at the beans, select two at a time. Two white beans = ff, two black beans = FF, one black and one white bean = Ff.
- Place the pairs of beans in the appropriate spot on the worksheet. Two white beans go on the white bunny marked ff. Two black beans go on the black bunny marked FF and one black bean and one white bean go on the black bunny marked Ff.
- When you have selected all individuals, count the number of each genotype: ff, FF, and Ff. Write these totals in the first three columns of the data table. In the first round, the total number of rabbits will be 50 because each rabbit requires two alleles.
- The furless bunnies, genotype ff, are susceptible to cold weather. The cold weather kills them before they reach reproductive age. Make an X over the number of individuals in the ff column to show that they have died.
- Count the alleles from the FF and Ff bunnies and record it on your data sheet. You can’t count the alleles of the ff bunnies because they have died!
- Determine the allele frequencies of F and f for each generation and record them in the chart.
- Place the alleles (beans) from the ff bunnies aside since they did not reproduce.
- Place the alleles of the surviving rabbits (which have grown, survived, and reached reproductive age) back into the cup and mate them again to get the next generation.
- Repeat steps 2-10 to obtain information about subsequent generations.
Wrap-Up
Discuss the following questions:
- What was the outcome of the “breeding bunnies” game?
- Did the allele frequencies change over time?
- What would happen if this bunny population lived in the tropics? (Perhaps the furred rabbits would die from the heat and the F allele frequency would decrease.)
- Why did the Hardy-Weinberg equilibrium not occur in this game? (Because natural selection caused the allele frequencies in the population to change. All the furless rabbits died and thus did not pass on their f alleles. Note that the small population size also violates the conditions for Hardy-Weinburg equilibrium, producing random changes in allele frequency. The changes due to natural selection are much more specific and noticeable.)
- Why did the lethal recessive allele not disappear immediately from the population? Did it ever completely disappear? (Individuals who inherit two recessive alleles have the lethal phenotype and are lost from the population. However, individuals who inherit one recessive allele and one dominant allele have the normal phenotype and survive. This allows the recessive allele to stay in the population for many generations.)
- This game is a good model for understanding natural selection, but it is not a perfect representation of a real situation. What are some ways that this simulation is unrealistic? (Because we don’t add beans during mating season and we remove beans in every generation, the population size gets progressively smaller. This would be unlikely in a real population unless other factors were involved. As the numbers of furless individuals decreased, the numbers of furred individuals would increase, and the population would be a similar size in each generation. Another unrealistic point is the mixing of all alleles in the cup, representing the gene pool. In reality, the gene pool is not separated from the individuals in this manner. Alleles from only two individuals are mixed through mating, rather than alleles from all individuals in the population mixing freely.)
Extension: Epistasis
With the addition of a pair of pennies, students can also model what might happen in an epistatic relationship. If H/T represent fur color alleles, perhaps B=Brown and b= white, then the gene for having fur is epistatic to the color gene, as it supersedes the question of fur color. If this option is chosen, it may make sense to flip much less than 50 times- 10 will likely suffice to make the point.
It can be illustrated that all epistatic relationships are, by necessity, di-hybrid crosses, but will yield different phenotypic ratios, as the ‘fur-color’ phenotype is masked when the rabbit has no fur.
Educator Background
In sexually reproducing organisms, offspring inherit one set of genes from each parent. Each individual has two copies of each gene, one copy inherited from its mother and one copy inherited from its father.
Each gene has multiple forms for any particular trait, called alleles. Some alleles are dominant: the trait associated with a dominant allele will always show up in the phenotype if that allele is present. Some alleles are recessive: the trait associated with a recessive allele will not show up in the phenotype if a dominant allele is also present. Dominant alleles mask the traits of the corresponding recessive alleles. The specific combination of alleles that an individual inherits determines its traits. For example, for human eye color, if a person inherits the recessive allele for blue eyes from her mother and the dominant allele for brown eyes from her father, she will phenotypically exhibit the dominant trait - brown eyes. However, if she inherits two recessive alleles for blue eyes, one from each parent, she will phenotypically exhibit the recessive trait - blue eyes.
Natural selection acts on the phenotype of an organism such that individuals with favorable phenotypes are more likely to survive and reproduce than those with less favorable phenotypes. The genotypes associated with the favorable phenotypes will increase in frequency in the following generations.
A population is a group of interbreeding individuals of a single species. Every individual in a population is genetically different. All alleles found in that population make up its "gene pool." A gene pool can be thought of as all the genes in a population at any given time, i.e., all the alleles at all the gene loci in all the individuals in the population.
Allele frequency refers to the frequency in the population of a particular allele relative to other alleles at the same gene locus. This is expressed as a proportion (between 0 and 1) or percentage (between 0 and 100%). Changes in allele frequency within a population over a period of time, from one generation to the next, is an example of evolution, and more specifically the small-scale evolutionary change known as microevolution.
A population that is not changing genetically is said to be at Hardy-Weinberg equilibrium. One of the most important points of the Hardy-Weinberg equilibrium model is that allele frequencies remain the same within a population from one generation to the next unless some factor acts to change them. Therefore, the Hardy-Weinberg theorem describes a population that is not evolving.
The Hardy-Weinberg theorem states that, "Under certain conditions of stability both allelic frequencies and genotypic ratios remain constant from generation to generation in sexually reproducing populations." In such a stable population there are no processes acting to change allele frequencies from one generation to the next. This requires certain conditions.
- There is no mutation
- There is no immigration or emigration
- The population must be large enough to make it highly unlikely that chance alone could significantly alter allele frequencies
- Mating is random
- There is no natural selection
In nature, many factors act to change allele frequencies. In this activity, students will monitor allele frequencies in a rabbit population over multiple generations. They will see that the rabbit population does not remain at Hardy-Weinberg equilibrium. This is because natural selection acts upon the rabbits and changes the frequencies of alleles within the population. In this particular example, furless rabbits are not fit for their environment and thus tend to die before reaching reproductive age. Therefore, they do not pass their alleles onto the next generation and over time the allele for furlessness decreases and may even disappear from the population. [The specific recessive trait of "furlessness" in rabbits was first described by an American geneticist named W.E. Castle in 1933.]
So why go to so much trouble to explain the Hardy-Weinberg Theorem if it describes a situation that never occurs in nature? The Hardy-Weinberg Theorem underlies all of evolutionary genetics and sets up the “null hypothesis”, i.e., evolution is not occurring. The discrepancies between an “ideal” Hardy-Weinberg population and real populations are the cause and evidence of evolution.
Next Generation Science Standards
While students will not be assessed on performing Hardy-Weinberg calculations, this activity could serve as part of a much larger unit that aims to address the below standards.
Related Performance Expectations
Remember, performance expectations are not a set of instructional or assessment tasks. They are statements of what students should be able to do after instruction. This activity or unit is just one of many that could help prepare your students to perform the following hypothetical tasks that demonstrate their understanding:
MS-LS4-6.Use mathematical representations to support explanations of how natural selection may lead to increases and decreases of specific traits in populations over time. [Clarification Statement: Emphasis is on using mathematical models, probability statements, and proportional reasoning to support explanations of trends in changes to populations over time.] [Assessment Boundary: Assessment does not include Hardy Weinberg calculations.]
HS-LS3-3.Apply concepts of statistics and probability to explain the variation and distribution of expressed traits in a population. [Clarification Statement: Emphasis is on the use of mathematics to describe the probability of traits as it relates to genetic and environmental factors in the expression of traits.] [Assessment Boundary: Assessment does not include Hardy-Weinberg calculations.]
Disciplinary Core Ideas
LS1.B: Growth and Development of Organisms
- Organisms reproduce, either sexually or asexually, and transfer their genetic information to their offspring.
LS4.C: Adaptation
- Adaptation by natural selection acting over generations is one important process by which species change over time in response to changes in environmental conditions. Traits that support successful survival and reproduction in the new environment become more common; those that do not become less common. Thus, the distribution of traits in a population changes.
LS3.B: Variation of Traits
- In sexually reproducing organisms, each parent contributes half of the genes acquired (at random) by the offspring. Individuals have two of each chromosome and hence two alleles of each gene, one acquired from each parent. These versions may be identical or may differ from each other.
- Environmental factors also affect expression of traits, and hence affect the probability of occurrences of traits in a population. Thus the variation and distribution of traits observed depends on both genetic and environmental factors.
Science and Engineering Practice: Using Mathematics and Computational Thinking
6-8: Use mathematical representations to support scientific conclusions and design solutions.
Crosscutting Concept: Cause and Effect
- Phenomena may have more than one cause, and some cause and effect relationships in systems can only be described using probability.
References
Adapted with permission from Evolution. (2001). Breeding Bunnies. WGBH Educational Foundation and Clear Blue Sky Productions, Inc. http://www.pbs.org/wgbh/evolution/educators/lessons/lesson4/act1.html
Originally adapted from Lapiana, J. (1994). Evolution and Gene Frequencies: A Game of Survival and Reproductive Success. Woodrow Wilson Biology Institute Laboratory. http://www.woodrow.org/teachers/bi/1994/evolution.html
Purves, W. K., Sadava, D., Orians, G. H., & Heller, H. C. (2001). Life: The Science of Biology (6th ed.). Sunderland, Massachusetts: Sinauer Associates, Inc.
Staff Reporter. Science Times (April 29, 2020). "Meet Mr. Bigglesworth; the Adorable Hairless Bunny With a Big Personality." Retrieved 27November2020 from https://www.sciencetimes.com/articles/25512/20200429/photos-meet-mr-bigglesworth-adorable-hairless-bunny-big-personality.htm
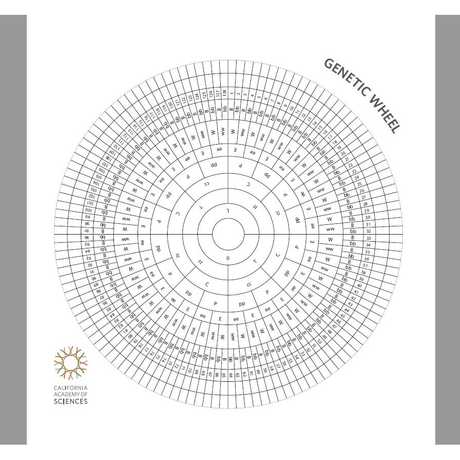
Use the genetic wheel to explore single gene traits of the student in your classroom.
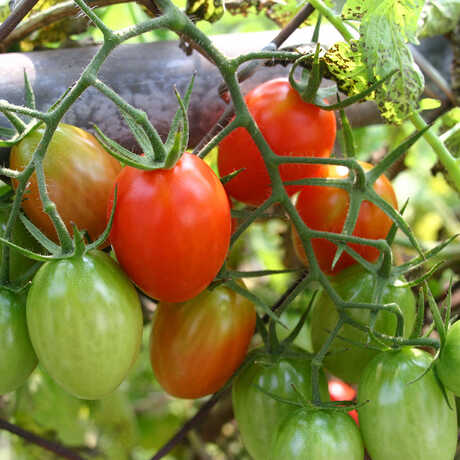
Model natural selection and explore the genetics behind color vision. What selective pressures affect vision?
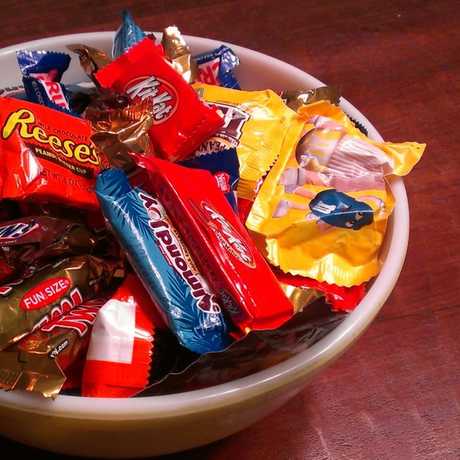
Students will (unknowingly) act as predators on candy in this introduction to your unit on natural selection.
Appropriate for: 7th Grade - 12th Grade
Standards for: 6th Grade, 7th Grade, 8th Grade, 9th Grade, 10th Grade
Prep Time: 10 minutes
Activity Time: 30 minutes
Subjects: Analyzing & Interpreting Data, Life Science, Patterns