We're open 10 a.m.–3 p.m. on Thanksgiving! View all holiday hours
0
In this activity demonstrating how scientists monitor coral reef health in the field, students will use real research methods to gather data about the diversity on a reef, analyze these data, and draw conclusions taking into account background information about their field site.
Objectives
- Students will use real research methods to gather data about the diversity on a reef
- Students will analyze data and draw conclusions based on the data and site background info
Materials
For the teacher
- Photographs of coral reef organisms to print and cut out
- Google sheet to input all class data, perform calculations, or analyze graphs
Per team of students
- One measuring tape or transect tape
- Easy-to-make quadrats (aim for 1m x 1m, or grab some hula hoops, instead!)
- Species survey worksheet set
Per student
Teacher Prep
Notes: This setup assumes a teacher will set up one reef for Scenario 1 and one reef for Scenario 2, adjusting the size of the research teams and/or rotating teams to conduct their survey in turns. You may download any of the associated Google dcuments or sheets to edit, as needed.
- Print and cut out the organisms. As you prepare two reefs along tables or countertops, each running approximately 12 meters long, you may use data from the sample counts to mimic the environmental conditions of the protected reef from Scenario 1, and the unprotected reef from Scenario 2, respectively (no need to copy the conditions exactly as shown). The crustaceans and large animals (shark + sea turtle) are not included in the survey sheets, but can also be scattered throughout.
- Prepare to divide the class into two research teams of at least 10 students each, one team for Scenario 1 and another for Scenario 2. Students will work in pairs or triads within their research team to count the number of organisms present along the transect for a given group of organisms: fish, coral, algae, echinoderms, or molluscs. Print one copy of the species survey worksheet set for each team.
- Print one copy for each student of the handouts containing background information, scenario descriptions, the procedure, and discussion questions.
- Set up a computer to serve as the location for students, or yourself, to input the collected data. You may use this sample sheet, zeroing out the numerals in the various Q1-Q5 columns, keeping intact the formulas for the totals.
- Produce a few quadrats that can be shared, or assign this to students as homework the day before (hula hoops could work in a pinch!). Find two measuring tapes or transect lines that span at least 12 meters.
Student-Led Procedure
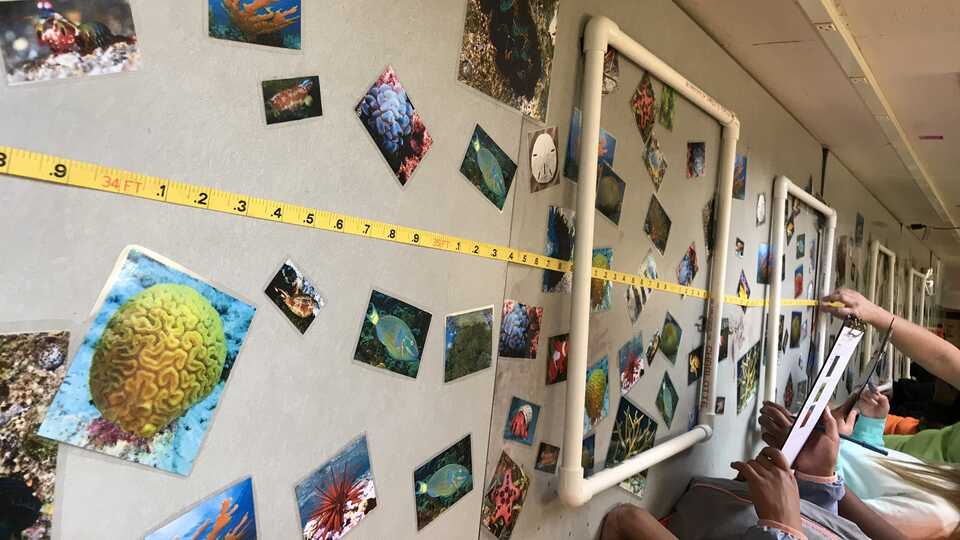
Transect Activity
- You have been divided into two research teams. Each team will survey a different coral reef site in Hawaii, either Scenario 1 or Scenario 2.
- Before you start, as a group discuss your site description and formulate a hypothesis about what you might find.
- As a group, lay out your transect line.
- Within your group, identify a buddy. You will work in pairs to survey a specific group of organisms using quadrats. Obtain a copy of the datasheet for your group of organisms. On the top of the page, record your names, date/time, and location (site) name.
- Place your quadrat at the 2m mark so that the transect tape intersects the middle of your quadrat. Record each species contained within your quadrat by placing a hatch mark in the corresponding row on the data sheet. If you find a species that is not listed on the data sheet, note it in your observations at the bottom of the page.
- When you have finished recording all of the data in your first quadrat, move your quadrat to the 4m mark on the transect. Repeat the exercise and record your results. Continue to repeat this procedure at 2m intervals along the entire transect line (that is, collect data at the 2m mark, 4m mark, etc.). You will have a total of 5 quadrats.
Data Analysis
After counting in all 5 quadrats, add up your tallies. You will enter your data on the laptop and graph your data to visualize your findings.
Discussion
After all buddy pairs have entered and graphed their data, re-assemble as a group. Look at your overall results and discuss your results with your group using the prompts on the following page.
Discussion Questions
- Which groups of organisms (e.g., corals, fish, algae) were most dominant at your site?
- Which were least dominant?
- Did you notice anything unusual about your site? Or did you take any additional notes or observations?
- What was the overall species richness in site?
- What was your hypothesis before you did the exercise, and did your data confirm or reject your hypothesis?
Background Information
How do scientists monitor coral reefs?
Sampling is the process by which organisms in small areas can be counted, or quantified, to estimate abundance over a larger area. The small areas, or samples, must be representative of the larger area for these estimates to be accurate. Sampling a reef allows us to estimate species richness, or the number of species in a given area. Species richness is one measure of the health of a reef, as healthy reefs generally have more species than degraded reefs. To calculate species richness, scientists count all the different species they find while sampling. Species richness does not tell us anything about the relative abundance of these species, but simply lets us know how many are present.
Transects and quadrats are two tools commonly used when sampling and monitoring coral reefs. A transect line is any line marked at regular intervals, such as a measuring tape, that is easy to use in the field. Quadrats are framed areas, such as squares made from PVC pipes. These tools provide a systematic method for determining species richness
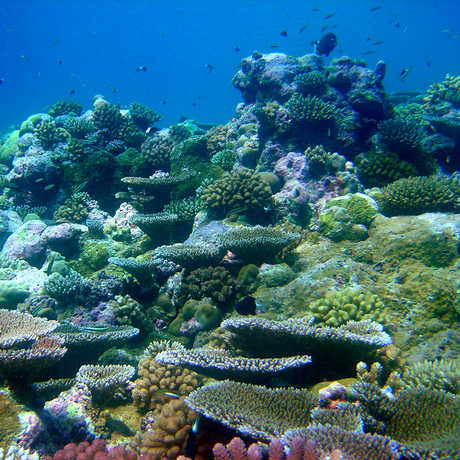
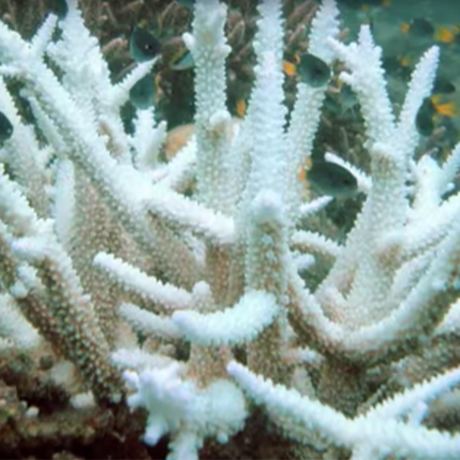
Heathy coral reef ecosystems are typically dominated by reef-building corals and fish. These reefs tend to have high species richness and abundance. On degraded reefs, which are those subject to human disturbances, corals tend to be outcompeted by invasive algae or to be smothered by sedimentation or trash. These reefs tend to have low species richness and abundance.
References
Activity written by Dr. Rebecca Albright, Dr. Allison Fritts-Penniman, and Ms. Christina Castillo, adapting COSEE Coastal Trends Corals and Climate Change Teacher Lesson Plan.
What is ocean acidification, and who is affected by it? Engage your students in a mock conference on the issue.
Around the world, many coral reefs are in hot water. How can we preserve these important and diverse ecosystems?
Browse our collection of classroom activity ideas to use with the Healthy Ocean series videos.
Appropriate for: 6th Grade - 12th Grade
Prep Time: 30 minutes
Activity Time: 50 minutes
Subjects: Analyzing & Interpreting Data, Constructing Explanations, Obtaining & Evaluating Information
Exhibits: Philippine Coral Reef