Special delivery! See our visiting baby yaks (Dec. 20–Jan. 5) this holiday. Learn more
0
Interpreting and making infographics are engaging methods for students to gain experience in the science practices of the Next Generation Science Standards. In this toolkit, we provide ideas, strategies, and resources to help teachers incorporate the study of infographics into middle school and high school science curricula. Infographics are applicable to practically all scientific disciplines, and even non-science courses as well. Use this toolkit to get started using infographics in your classroom.
Toolkit Contents
Teacher Background
What are infographics?
Why use infographics?
Incorporating infographics into your curriculum: Four approaches
1: Interpreting Infographics
2: Visually Representing Data
3: Critiquing Infographics
4: Making Infographics
Alignment to the Standards
Next Generation Science Standards
Common Core State Standards
Teacher Background
What are infographics? Infographics are visual representations of information, data, or knowledge meant to present complex information quickly and clearly. Infographics use many different strategies to present information, including graphs, charts, maps, diagrams, and pictures (and often a mixture of several of these).
Professionals in the field differentiate between science data visualizations and infographics. Science data visualizations are often used by professional scientists to investigate or present their data. They can be exploratory (used in the process of figuring out what patterns are present in the data) or explanatory (used to show or explain patterns found in the data); and they often deal with large, complex, multidimensional data sets that require computers to analyze. Infographics, on the other hand, are generally less formal, can be simple or complex or anywhere in between, and are used to visually communicate any type of information clearly and efficiently. The Academy is home to experts in both science data visualization and the production of infographics, and both contributed to the development of the pilot project this toolkit is based on.
For the purposes of this toolkit, we will consider science data visualizations and infographics to be points on a continuum rather than separate ideas, and we will use the term “infographic” to refer to both. We will think of an infographic as something that visually tells a story with scientific data.
Why use infographics? Interpreting, critiquing, and producing infographics are great ways for students to learn and practice key science literacy skills. When students interpret infographics, they practice reading and understanding graphs, charts, diagrams, and maps; finding patterns in data and interpreting their meaning; and arguing from evidence to support their interpretation of the infographic. When students critique others’ infographics, they practice using evidence to support an argument. When students create their own infographics, they gain experience analyzing data, finding and explaining patterns in data, and thoughtfully deciding how to visually present that data.
Infographics, therefore, provide a good framework for incorporating science practices emphasized in the Next Generation Science Standards (NGSS) into middle school and high school science lessons. For instance, these Science and Engineering Practices from the NGSS can be taught through the use of infographics or easily incorporated into an infographics lesson (see the end of this toolkit for more specific information on NGSS standards):
Incorporating infographics into your curriculum: Four approaches
There are many ways to incorporate infographics into your science curriculum, from a one-time fun activity to a year-long focus. You could do a single unit focused on infographics (probably over several class periods); our sample lesson plans were originally developed for just such a unit, to be completed over about six one-hour class periods.
However, our recommendation is to incorporate infographics work into your science curriculum throughout the year, a bit at a time. Infographics can be used to communicate information and data from virtually any scientific discipline (biology, earth science, chemistry, etc.), so your students can practice interpreting and making infographics no matter what science subject they are studying. So many skills are involved in using, interpreting, and making infographics that we believe it makes sense to revisit them several times throughout the school year, building new skills and practicing old ones each time.
Below, we have outlined four approaches for using infographics: Interpreting Infographics, Visually Representing Data, Critiquing Infographics, and Making Infographics. For each approach, we provide ideas for ways to use the approach and helpful resources. Though these can be presented to students in any order, we suggest starting with at least some elements of the first and second approaches before continuing on to making infographics.
Approach 1: Interpreting Infographics
The first step in learning about infographics is learning to interpret infographics made by other people. And for that, you’ll need some infographics to practice on!
See Activity 1 and Activity 2 for the infographics we used in our pilot program. Some other good sources for infographics to ask students to interpret are listed below. Note that several of these sources do not necessarily contain science-based infographics, and that’s okay! We feel that when you are first introducing the topic of infographics and asking students to interpret them, it makes sense to use graphics about topics students are already interested in. For example, infographics based on sports data are often good for capturing student interest. You can combine infographics with science content later on.
Here are a few good sources for infographics to ask students to interpret:
- David MacCandless’s website (http://www.davidmccandless.com/) and books are great sources for infographics on a variety of topics. His TED talk makes a really great introduction to infographics.
- Edward Tufte (http://www.edwardtufte.com/) has written several books on information visualization that are good sources of infographics.
- NYTimes.com has a lot of news-related and interactive visuals. “2012: The Year in Graphics” is particularly great. (http://www.nytimes.com/interactive/2012/12/30/multimedia/2012-the-year-in-graphics.html?_r=0)
- http://visual.ly/ (click the “Community” tab at the top of the page to see a gallery of infographics)
- http://flowingdata.com/ (click the “Projects” tab at the top of the page for a gallery of infographics)
- This post on Francesco Mugnai’s blog lists 50 great examples of infographics: (http://blogof.francescomugnai.com/2009/04/50-great-examples-of-infographics/). Here’s a list of other similar posts on the same blog: http://blogof.francescomugnai.com/category/infographics/
- “Teaching With Infographics,” a series of blog posts on The Learning Network from the NY Times, has lots of links to good infographics to use in the classroom and other useful resources (http://learning.blogs.nytimes.com/2010/08/23/teaching-with-infographics-places-to-start/?_r=0)
When picking infographics for your students to interpret, make sure to pick infographics that tell a story with data (even if the topic is not explicitly “scientific”). If you search for “infographics” online, you will find some that explain a procedure, or present several unrelated facts, or define a list of terms. While these are all infographics and are sometimes very entertaining, we do not recommend these for use with this toolkit as they often do not have a single story and lack good multi-dimensional data.
When students are interpreting infographics for the first time, they will need some guidance for how to look at them. Here are some ideas for questions to ask your students about while interpreting infographics:
- What ideas or pieces of information does the author represent?
- What is the main conclusion or story you can identify from the graphic?
- What do the numbers in the graphic represent, i.e. what are the units?
- Where did the data come from, and how was it collected?
- How are the numbers/data in the graphic represented? (E.g., does the author use graphs, charts, maps, etc.? Do they use color, pattern, size, or position to communicate about the data?)
- What other ways does the author tell the audience about the key message(s)?
- What questions do you have about the graphic? What confuses you?
- What do you like and dislike about the graphic?
Approach 2: Visually Representing Data
There are many ways to visually represent numbers and data. Listed below are some of the common strategies used in infographics (sometimes more than one is used in the same graphic)
- Line graph: Commonly used to show change in a variable over time, with time on the x-axis and a related dependent variable on the y-axis
- Bar graph: Used for comparing quantities in different groups or categories
- Scatter plot: Used to show relationship between two variables (independent variable on the x-axis, dependent variable on the y-axis)
- Pie graph: Used for showing the parts that make up a whole
- Charts: Used for showing relationships among several entities; position, lines, arrows, etc. show how the entities relate to each other
- Maps: Used for location-based data; can use color, size, etc. to compare quantities associated with different places
- Diagrams: Schematic pictures of objects/entities, showing where the important parts are located and how they interact
- Representational visuals (pictures): Used to represent a particular object, person, place, etc; size, position, and/or color can be used to communicate additional information about the object/person/place
There are also many ways to represent numbers visually, either within a traditional graph or on their own. Here are a few of the most common strategies:
- Position
- Length
- Angle
- Area
- Volume
- Color hue (red, blue, green, etc.)
- Color saturation (darker or lighter)
To help students understand that different visualization strategies are appropriate for different data and different situations, you could have them extract data (numbers) from one infographic, and then present that same data in a different form. For example, they could take the numbers from a bar graph and try to present it as a pie chart. Some transformations will be relatively straightforward, but some will be difficult or impossible. Can you present a map as a scatter plot? Representational images as a line graph? A pie chart as a diagram? This exercise drives home the point that not all forms of visualization are appropriate in any given situation.
You could also pick a few different data sets, and ask your students to decide how best to represent each data set. Try graphing or otherwise visually representing the data a few different ways and see which one works best and communicates any patterns in the data most clearly. Why?
Approach 3: Critiquing Infographics
To get your students feeling comfortable critiquing infographics, have them start by just thinking about what they like and dislike about them. Have them study existing infographics from various sources and work together as a class to come up with a list of qualities of a good infographic. You could then compare your class’s list with the one below created by Academy experts—how are they similar or different?
You could also have your class critique infographics after introducing a list of design principles, such as the one below. How well do the infographics fulfill the principles? How does that affect the overall impact or effectiveness of the infographics? How would you improve the infographics, keeping the design principles in mind?
Another way to focus on these infographic design principles is to compare and contrast infographics that present the same data in different ways. Which strategies are most successful in each case, and why? For our pilot program we created several pairs of infographics presenting the same data in different formats, which can be found in Contrasting Graphics.
Here are list generated by our Academy experts about what makes a good graphic. You and your students might come up with additional ideas, too!
- Keep it simple.
- Aim to impart one or two key messages.
- Did you highlight key patterns that seem to have meaning in the real world?
- Can your viewers summarize your message(s) in a single sentence?
- Try to impart something your audience will be drawn to, remember, and share. Know your audience.
- Everything on your graphic should have a reason for being there.
- Pretend ink is expensive, so use as little as possible to tell your story.
- Use color to reinforce your message, not solely for design.
- Use basic, intuitive representations.
- Don’t include unnecessary dimensions of data (time, space, feature, etc.).
- Aim to impart one or two key messages.
- Tell the truth.
- Keep it accurate.
- Did you pull the numbers correctly?
- Keep in mind where your data came from. How was it collected? Context is essential.
- Did you cite your data sources?
- Use labels to eliminate ambiguity.
- Be fair.
- Choose your statistics wisely. Means/averages, medians, and percentages tell different stories.
- Did you represent the numbers and scale accurately? Make things proportional and appropriate to the numbers.
- Are you comparing like things (similar attribute, dimension, time scale, etc.)?
- Dots, lines, area, and volume convey different messages. Consider carefully which you will use.
- Be aware of ways your graphic could be misinterpreted. Do your graphs show what you think they show? (Challenge yourself to reinterpret your graphic.)
- Keep it accurate.
- Blow them away.
Approach 4: Making Infographics
Now that your students are infographics experts, they are ready to try their hands at designing their own infographics! In our pilot program, this was by far the most challenging section for the students. Be aware that they will probably need a lot of guidance and scaffolding to complete this project. We think it is worth it, though, because of the invaluable skills they will be practicing: analyzing and graphing data, and communicating their findings by arguing from evidence.
To get started, you’ll need some data to work with. Your students could collect their own data by doing an experiment or a survey, or you could provide data from an outside source. Here are some places to look for good, interesting data sets:
- The Federal government (http://www.data.gov/) and CA government (http://data.ca.gov/) make a lot of data sets available on many different topics
- California Department of Fish and Wildlife (https://www.wildlife.ca.gov/) makes some data available
- NOAA has a “Data in the Classroom” initiative (http://www.dataintheclassroom.org/) that includes real data on ocean-related topics (in our pilot program we used data on El Nino weather patterns from NOAA along with fishery data from the CA Dept. of Fish and Wildlife)
- GLOBE (http://www.globe.gov/) is another good resource for climate and weather data
Whatever data you choose to use, make sure the data shows some sort of interesting pattern. You want your students to have a story to tell when they make their infographics! Cherry-picking the most interesting data like this can feel a bit like “cheating,” but in this case we think it’s worth it to make this a fun and memorable experience for the students.
Once you have located a suitable data set, format the data in a very simple and clear table to give to your students. You want the data to be as easy to understand and as unintimidating as possible.
Now that you’ve formatted the data, the next step is to help your students identify what patterns are present in the data, and what they might mean. The best way to do this is to have your students graph the data a few different ways and see what patterns emerge. You might have them try using different types of graphs, or grouping the data in different ways (such as graphing according to different time intervals, like months and years). Often, different patterns will show up depending on how you graph the data.
Be aware that many students will require very specific, step-by-step instructions for graphing. You may want to prepare a worksheet for students to complete or at least a detailed instruction sheet to go with the data table. (See Activity 4 for an example.) Graphing can be done either with computers (using Microsoft Excel or a similar program) or by hand.
Once your students have identified a pattern (or patterns!) in the data, help your students think more deeply about the meaning of the pattern. What does the pattern tell us? What are some possible explanations for the pattern? What story is the data telling? This is the story your students will illustrate with their infographics!
Now your students are ready to start planning and making their infographics! This can be done a few different ways.
We highly recommend having your students design their infographics on paper (rather than on computers), because it means they do not have to spend time learning new software. If you choose to have your students design their graphics by hand, we also recommend having them create a concept sketch rather than a polished graphic. Their sketch should include all the elements they would include in their finished graphic (graph, pictures, color, etc.), but it does not have to be perfectly to scale. We recommend this because making pictures or graphs perfectly to scale by hand can be very time-consuming and difficult. Making a concept sketch forces students to focus on the most important step—deciding how to present the data and tell its story.
Alternatively, you may choose to have your students make infographics using computers. If you do this, below are just a few different tools you could use, but please note that we are not endorsing any of these specifically
- Adobe software such as InDesign, PhotoShop, and Illustrator:
These are both expensive to procure and complicated to use, but if they are available to you and your students know how to use them, they are some of the most powerful tools available for creating digital graphics.
- Free alternative design programs These programs are free and often have similar functionality to the more expensive programs. Some examples are Inkscape (https://inkscape.org/en/), which is similar to illustrator and Scribus (http://www.scribus.net/canvas/Scribus), which is similar to InDesign.
- Free online infographics tools:
There are several online tools for creating infographics. Often the free version has limited features, but that may not be a problem for this project. Here are a few: http://piktochart.com/, https://infogr.am/, https://venngage.com/, http://www.easel.ly/
No matter whether your students work by hand or on a computer, here are some things they should keep in mind as they design their graphic:
- What are you trying to show or teach your audience? What do you want them to learn from your infographic?
- How will you present the data? This will probably involve a graph, or at least a visual representation of numbers.
- Remember that an infographic is more than just a graph! You can use pictures, colors, labels, maps, charts, and more to help tell your story.
- Remember the qualities of a good infographic!
Once your students have created their infographics, allow time for them to view and critique each other’s graphics (keeping the qualities of a good infographic in mind).
Alignment to the Standards
Next Generation Science Standards
Analyzing and Interpreting Data
Middle School
[Note: this Practice can be incorporated into an infographics lesson when the students analyze and graph a data set in order to identify patterns in the data. The first middle school standard can also be addressed by having students interpret the story told by an existing infographic.]
- Construct, analyze, and/or interpret graphical displays of data and/or large data sets to identify linear and nonlinear relationships.
- Use graphical displays (e.g., maps, charts, graphs, and/or tables) of large data sets to identify temporal and spatial relationships.
High School
- Analyze data using tools, technologies, and/or models (e.g., computational, mathematical) in order to make valid and reliable scientific claims or determine an optimal design solution
Mathematical and Computational Thinking
Middle School
[Note: These standards can be incorporated when students analyze and graph data to look for patterns to illustrate in their infographics, especially if computers are used for this step. However, even graphing data by hand would be excellent practice for your students that would lay the groundwork for later learning to analyze and graph data on a computer.]
- Use digital tools (e.g., computers) to analyze very large data sets for patterns and trends
High School
- Use mathematical, computational, and/or algorithmic representations of phenomena or design solutions to describe and/or support claims and/or explanations.
Constructing Explanations and Designing Solutions
Middle School
[Note: these standards are addressed when students come up with explanations for patterns they see in data. These patterns and explanations can then be illustrated and communicated in the infographics the students design.]
- Construct an explanation that includes qualitative or quantitative relationships between variables that predict(s) and/or describe(s) phenomena.
- Apply scientific ideas, principles, and/or evidence to construct, revise and/or use an explanation for real-world phenomena, examples, or events.
High School
- Make a quantitative and/or qualitative claim regarding the relationship between dependent and independent variables.
Engaging in Argument from Evidence
[Note: there are many possible ways to integrate arguing from evidence into an infographics lesson. For instance, students could argue from evidence to support their interpretation of the story told by a data set, and then design an infographic to explain/support that interpretation. Alternatively, they could argue from evidence to support their interpretation of the main idea of an existing infographic. Or they could compare multiple infographics on similar topics and analyze whether they tell the same story.]
Middle School
- Compare and critique two arguments on the same topic and analyze whether they emphasize similar or different evidence and/or interpretations of facts.
- Construct, use, and/or present an oral and written argument supported by empirical evidence and scientific reasoning to support or refute an explanation or a model for a phenomenon or a solution to a problem.
High School
- Construct, use, and/or present an oral and written argument or counter-arguments based on data and evidence.
Obtaining, Evaluating, and Communicating Information
[Note: there are many ways to incorporate standards from this Practice into an infographics lesson, if desired. For example, students could research a topic using books, other scientific texts, and the internet and then make an infographic explaining their findings.]
Middle School
- Integrate qualitative and/or quantitative scientific and/or technical information in written text with that contained in media and visual displays to clarify claims and findings.
- Communicate scientific and/or technical information (e.g. about a proposed object, tool, process, system) in writing and/or through oral presentations.
High School
- Communicate scientific and/or technical information or ideas (e.g. about phenomena and/or the process of development and the design and performance of a proposed process or system) in multiple formats (i.e., orally, graphically, textually, mathematically).
Common Core State Standards - English Language Arts
Speaking and Listening: Comprehension and Collaboration
Grades 9-10
1. Initiate and participate effectively in a range of collaborative discussions (one-on-one, in groups, and teacher-led) with diverse partners on grades 9–10 topics, texts, and issues, building on others’ ideas and expressing their own clearly and persuasively.
2. Integrate multiple sources of information presented in diverse media or formats (e.g., visually, quantitatively, orally) evaluating the credibility and accuracy of each source.
Grades 11-12
1. Initiate and participate effectively in a range of collaborative discussions (one-on-one, in groups, and teacher-led) with diverse partners on grades 11–12 topics, texts, and issues, building on others’ ideas and expressing their own clearly and persuasively.
2. Integrate multiple sources of information presented in diverse formats and media (e.g., visually, quantitatively, orally) in order to make informed decisions and solve problems, evaluating the credibility and accuracy of each source and noting any discrepancies among the data.
Reading Standards For Literacy In Science And Technical Subjects: Integration of Knowledge and Ideas
Grades 9-10
7. Translate quantitative or technical information expressed in words in a text into visual form (e.g., a table or chart) and translate information expressed visually or mathematically (e.g., in an equation) into words.
Grades 11-12
7. Integrate and evaluate multiple sources of information presented in diverse formats and media (e.g., quantitative data, video, multimedia) in order to address a question or solve a problem.
8. Evaluate the hypotheses, data, analysis, and conclusions in a science or technical text, verifying the data when possible and corroborating or challenging conclusions with other sources of information.

Explore the ever-expanding web of life—and our place in it—in our original planetarium show. Now playing daily.
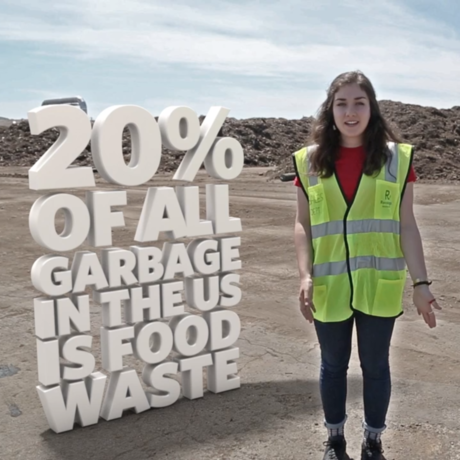
This youth-powered series tackles complex environmental topics and empowers viewers to make a difference.