Habitat Earth in the Classroom
Browse a rich array of educational resources from the award-winning show, Habitat Earth.
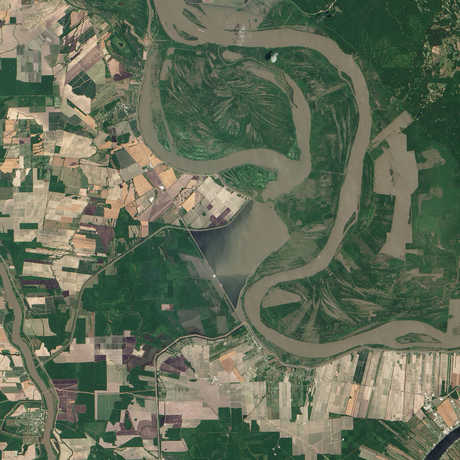
©NASA/GSFC/Jeff Schmaltz/MODIS Land Rapid Response Team
Observations inspire scientific questions and drive discoveries. In this activity, students will watch a visualization of empirical scientific data to explore seasonal changes in primary productivity on the earth. They will then formulate and research their own scientific questions about primary productivity on the earth and present their research in a classroom scientific poster session.
After this activity, students will be able to:
Observations inspire scientific questions and drive discoveries. In Part I of this activity, students will watch a short visualization clip showing global seasonal changes in photosynthesis on the earth to practice making observations and formulating hypotheses using empirical scientific data. Students will witness how scientific questions evolve from observations, and in Part II they will practice forming their own science questions.
Living plants play an extremely important role in regulating the amount of carbon dioxide (CO2) in the atmosphere. Through photosynthesis, plants take in CO2 and convert the carbon into sugar molecules (carbohydrates) using water and energy from the sun. In the process of breaking down these molecules and creating food for themselves, plants release oxygen back into the atmosphere for humans and animals to breathe. This process occurs in land plants, in algae, and in other primary producers of our oceans, such as microscopic phytoplankton.
Although CO2 is broken down during photosynthesis, some CO2 is released back into the atmosphere as plants respire. The amount of CO2 taken in by vegetation during photosynthesis minus the amount of CO2 put out during respiration equals Net Primary Productivity (NPP), or the total amount of CO2 absorbed by plants (NASA, retrieved May 2015):
CO2 taken in – CO2 respired out = Total CO2 absorbed by vegetation = Net Primary Productivity
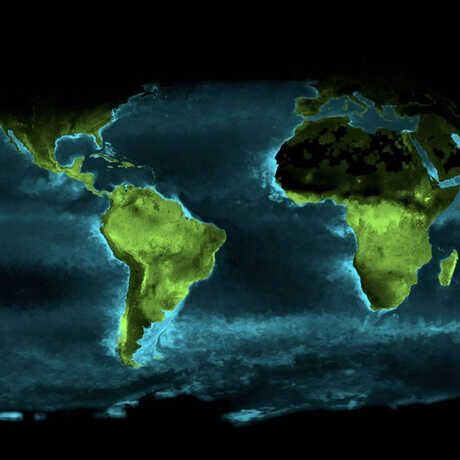
The chemical reaction by which plants produce complex food molecules requires an energy input from sunlight to occur. On land and in the ocean, the availability of light from the sun limits the amount of energy plants can use for photosynthesis, in turn limiting the amount of CO2 they are able to take in. The seasonal variability of light and its effect on NPP is illustrated in the Timelapse: Photosynthesis Seen from Space visualization. An increase in NPP is reflected in both the Northern and Southern Hemispheres during their respective summer months. Each hemisphere is exposed to more direct sunlight during its summer season because it is tilted towards the sun, therefore increasing the amount of energy available to producers.
While sunlight has a great impact on NPP, there are some variations in productivity due to other factors on land and in water that also influence the amount of CO2 plants are able to absorb (Lindsey, 2003) Notice that some land regions on the map show very little NPP year round. Some deserts, such as the Sahara in Africa, may receive an abundance of sunlight depending on their distance to the equator; however, the lack of available water limits the extent plants can photosynthesize during the daytime for fear of desiccating, resulting in a lower amount of carbon absorbed by plants living in these climates.
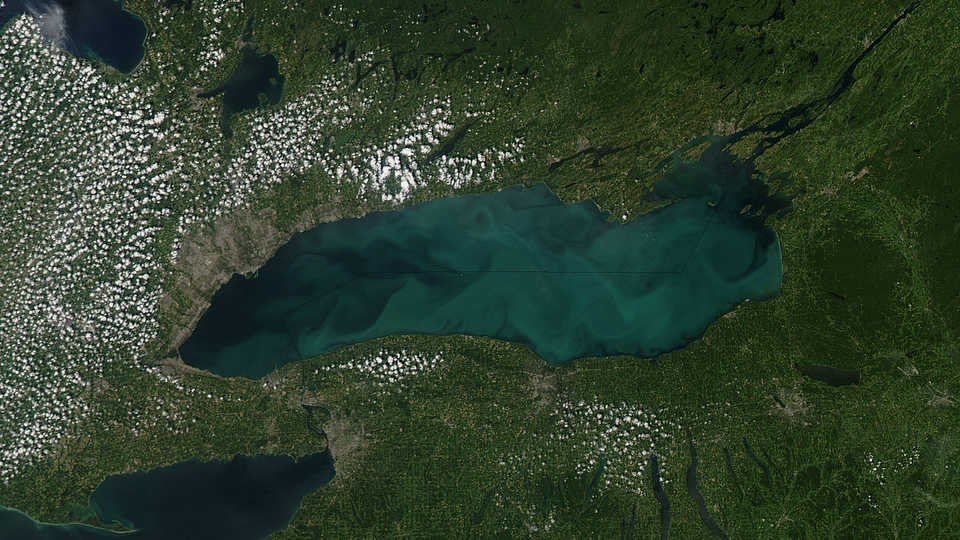
In the ocean, the availability of nutrients, especially nitrogen, greatly impact NPP (Behrenfeld, 2006). Water bodies with an abundance of nutrients tend to have a higher phytoplankton population. An increase in the distribution of phytoplankton means an increase in the amount of CO2 being absorbed during photosynthesis, and an increase in the NPP of that region.
In addition to providing oxygen and regulating carbon levels, plants contribute immensely to the success of human culture and economies. Both on land and in the ocean, plants provide energy and nutrients vital to the growth of consumers higher on the food chain (National Wildlife Federation, retrieved May 2015). For humans, these plants provide more than just energy and nutrients in the form of food. Plant products like paper, clothing, and medicine have significantly shaped and influenced the development of human cultures and contribute greatly to the foundation of human economies.
Disciplinary Core Ideas (6-8)
Science and Engineering Practices (6-8)
Cross-Cutting Concepts (6-8)
Behrenfeld, M. J., O’Malley, R.T., Siegel, D.A., McClain, C.R., Sarmiento, J.L., Feldman, G.C., Milligan, A.J., Falkowski, P.G., Letelier, R.M., & Boss, E.S. (2006). Climate-driven Trends in Contemporary Ocean Productivity. Nature 444, 752-755.
Lindsey, R. (2003) Global Garden Gets Greener. Retrieved August 2015 from the NASA Earth Observatory website: http://earthobservatory.nasa.gov/Features/GlobalGarden/
National Wildlife Federation (n.d.). Food Webs and Bioaccumulation. Retrieved May 2015 from http://www.nwf.org/Wildlife/Wildlife-Conservation/Food-Webs.aspx
NASA (n.d.) Global Maps: Net Primary Productivity. Retrieved May 2015 from http://earthobservatory.nasa.gov/GlobalMaps/view.php?d1=MOD17A2_M_PSN
Can we use a model to predict the impacts of nutrient pollutants on an aquatic ecosystem?
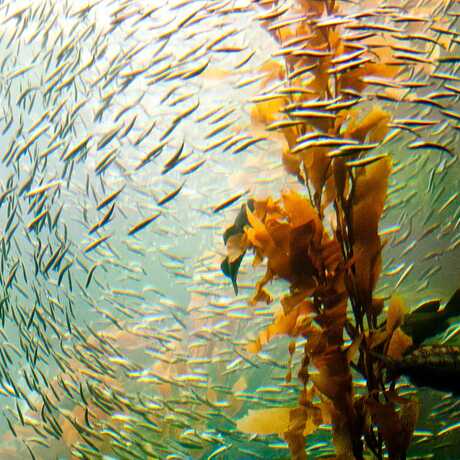
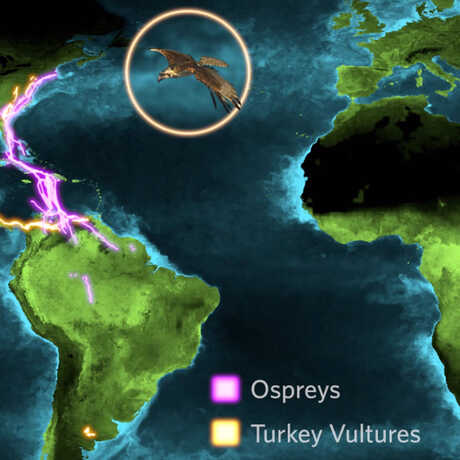
Could you describe the kelp forest food web as a system?
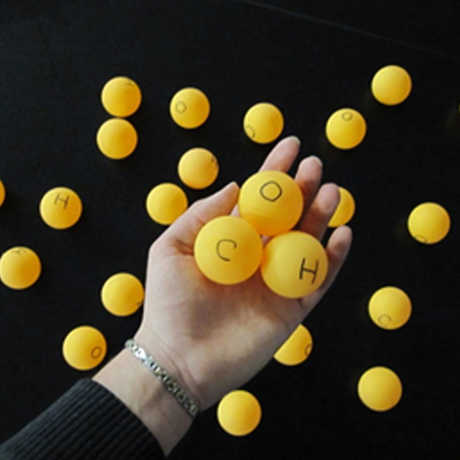
In this active model, students will simulate sugar molecule production to store energy—using ping pong balls!
Browse a rich array of educational resources from the award-winning show, Habitat Earth.