Special delivery! See our visiting baby camels (Dec. 6–19) and yaks (Dec. 20–Jan. 5) this holiday. Learn more
0
By conducting their own survey of an outdoor environment, students will examine a method for assessing litter, identify how humans impact the environment, and design solutions for preventing marine debris.
Objectives
Students will be able to:
- design and evaluate models of waterways in order to predict real world results.
- assess human impact on an environment by analyzing and interpreting students-collected data.
- design and communicate some solutions for preventing litter in Earth’s waterways.
Materials
Part 1 – Watershed Investigation
- Plain white paper (several sheets per group)
- Cafeteria trays, baking sheets, or cardstock (1 per group)
- Permanent Markers (2-3 per group)
- Orange washable marker (1 per group)
- Spray bottle with water
- Topographic map of your area (can be pulled from Google Maps Terrain)
Part 2 – Outdoor Survey
- Map of the area you will be surveying (if different from above)
- 30.5 meter (100-foot) rope, or tape measure
- Survey Markers, or land marks
- Gloves (1 set per student)
- Tongs/ Litter Grabbers (1 per student)
- Trash Bags for clean-up (1 per small group)
- Optional – Camera & GPS
- Pencil & Copies of Surveys (1 per small group)
Teacher Prep
- Acquire a map of the area around your school (can be pulled from Google Maps, Terrain)
- Consider building an example of the 3D model that students will create.
- Scout out the area(s) to be surveyed. It might be good to select a few locations.
- Get or make a map of the area that you are surveying.
- Put together packets of materials for students to use in the field: gloves, tongs, trash bag, pencils & surveys on clipboard.
Activity Part 1 – Watershed Investigation
Introduction
Show students the topographic map of the area you will be assessing. Ask them to discuss what features they see, and what they think the different colors, or lines, or symbols on the map represent. If the map is of your town, or neighborhood ask them to identify where the school is located. This may help them think about what the different features of the map represents. Let students know that a topographic map is a model of physical features of the Earth, and that they will be exploring how to make a model of their local area. The model will be used to explore the guiding question “How does the shape of the Earth’s surface influence where pollution accumulates?”
What to do
- Pass out the supplies to students. Let them know that they are to build a 3D model of their area by using paper, and markers.
- Students will use permanent markers to outline and define various areas of their map using appropriate colors such as:
- Black or brown—mountains
- Green—agricultural areas
- Blue—rivers, lakes, streams, ocean
- Gray—urban areas and buildings
- Have students predict where most of the pollution and litter would be. Using a washable marker, add litter to the map by making lots of dots and streaks over the area.
- They will then crumple the paper in order to give it appropriate elevation. Tape down the four corners of the crinkled paper onto a tray, or larger piece of card stock. To give the model a variety of elevations, the paper should not be taped completely flat.
- After the models are completed and predictions have been made, spray the map with water, and have students discuss their observations:
- What happens to the pollution?
- Where does it end up, and why?
- What types of pollution do they think exist in your area? (litter, oil, etc.)
Reflection on Modeling
Lead a discussion on the use of models to understand science.
- What can be learned from this model?
- What limitations does the model have?
- Let’s reflect on our guiding question: How does the shape of the Earth’s surface influence where pollution accumulates?
Activity Part 2 – Rapid Trash Assessment
Introduction
In the last activity we explored ways in which Earth’s physical features might influence where pollution ends up. In this activity we are going to use our previous learning to help us understand our next guiding question: How does our local community contribute to pollution in our waterways?
It might help to have students begin by thinking about: Why do you think it’s important to know where pollution lies in our community? Some answers that might come up are: because pollution effects humans, and animals. Or so you know where the pollution come from, and who to ask to stop.
How to do the Survey
- Review the learning from last time: Pollution often ended up in waterways, or running downhill towards a waterway. Pollution from the waterways often flows into the ocean. To see how much pollution exists in your area, we will be going outside to examine potential threats, and to determine their sources. Today we will be assessing pollution that we can easily see – litter, or something that can be called “marine debris.”
- Teacher Tip: If you are surveying a waterway, let them know that you will try to figure out what the threats are to waterways, and where the threats are coming from. If you are surveying your schoolyard, or an area without a waterway, let the students know that they will be trying to figure out how their area might affect ecosystems and people further down their watershed, or looking for what could happen to the trash during storm runoff.
- Teacher Tip: If you are surveying a waterway, let them know that you will try to figure out what the threats are to waterways, and where the threats are coming from. If you are surveying your schoolyard, or an area without a waterway, let the students know that they will be trying to figure out how their area might affect ecosystems and people further down their watershed, or looking for what could happen to the trash during storm runoff.
- Split students up into small groups of 2-3. Go over the equipment and survey tools in the classroom before you leave. Additionally, go over any health or safety rules that you wish to share (some general rules are listed on the survey). This will help students understand what to do when they get outside.
- Share a map of the area in which you are surveying. If you are open to it, have students select 100-foot sections to survey, and compare. They can make predictions of
- Where they think they will see more or less trash, and why?
- What types of trash they will see, and why?
- When you are outside, have students collect their data, and collect the trash that they find. Have them select and describe a piece of trash that they think shows evidence of being transported by water or wind.
Analyzing & Interpreting Data
When students are done collecting their data, head back inside, or to a quieter space to analyze the data, and begin to think about what it means.
- Based on the data, what do you think is the biggest direct threat to human life? What about the biggest threat aquatic life?
- Based on your evidence, where do you think that threat comes from?
- Is there other data, measurements or information that would be helpful in assessing the threats to humans and wildlife?
- In general, what patterns did you notice, and what might you tell other citizens or scientists about trash impacts in your survey area?
Designing Solutions
- Thinking about the biggest threat and its sources, brainstorm some solutions to the issue specific to your location.
- Teacher Tip: Really challenge students to think about Cause and Effect when coming up with their ideas for solutions. You might need to introduce them to the 4 R’s: Refuse, Reduce, Reuse & Recycle. For example, a sentence frame that can be helpful is “Because _________ is a problem, a solution that I can do is ____________.” For example:
- “Because _(excess single use chip bags)___ is a problem, a solution that I can do to reduce that is _(buy bigger bags of chips, and transport smaller quantities in Tupperware)__.”
- “Because (we sometimes need to buy things with packaging such as milk), but plastic is the biggest problem, a solution to plastics that I can do is (buy things in waxed paper or cardboard containers since they decompose over time).
- “Because (people keep dumping things along our levee), a solution that I can try is (putting up signs that tell people where they can take their trash, and how they help the environment when they do.)
- Have students think about “What solution could you do to make a difference in this problem?“ Each student should design a plan that s/he can follow. They should choose something that is new to them. Write out the steps it would take to be successful. Be as explicit as possible
- Step 1: Get a reusable water bottle that can fit in my backpack/ purse.
- Step 2: Set it next to my bag so that when I leave home I see it and remember to fill it.
- Step 3: Celebrate my success by saying “I am an Ocean Super Hero!”
- Step 4: Share your success with others.
- Have students share their action steps with a partner. See if there are any ideas or tips that partners can offer each other. Have the pairs be accountability partners, so that they check in with each other on how the goals are going.
- Teacher Tip: This is an opportunity to generalize what it’s like to make a plan. Studies show that people are much more likely to follow through if they have a concrete plan, and if they’ve made a commitment to get it done to somebody else. This planning tool can be used for all sorts of planning such as getting homework completed, meeting financial goals, etc.
Wrap Up
Restate the guiding questions for the lesson. Have students reflect and discuss on the activities. What parts of the lesson helped them gain insights to the following guiding questions?
- How does the Earth’s surface effect the accumulation of trash?
- What are the major trash sources of humans on your local waterways?
- How might we design solutions to protect Earth’s resource and environment?
Extensions
- Repeat the survey on a monthly basis, and have students compare the results over time. Additionally, compare results with other sites, or compare to see if there is change over time.
- Students can look at more data from open water, and sub-surface dives to see if the data they collected mirrors what other groups have collected from the connected environments.
- Project Aware: Dive Against Debris Project: www.projectaware.org/diveagainstdebrismap
- 5 Gyres Project: http://5gyres.org/
- Write letters of support, or thank you notes to businesses that support minimal packaging. Conversely they can also write letters to businesses to let them know how to be more sustainable. Use the “Create a Campaign” lesson, or “Convince Me” activity as a guide:
Scientific Terms for Students
accumulate: gradually gather over a period of time
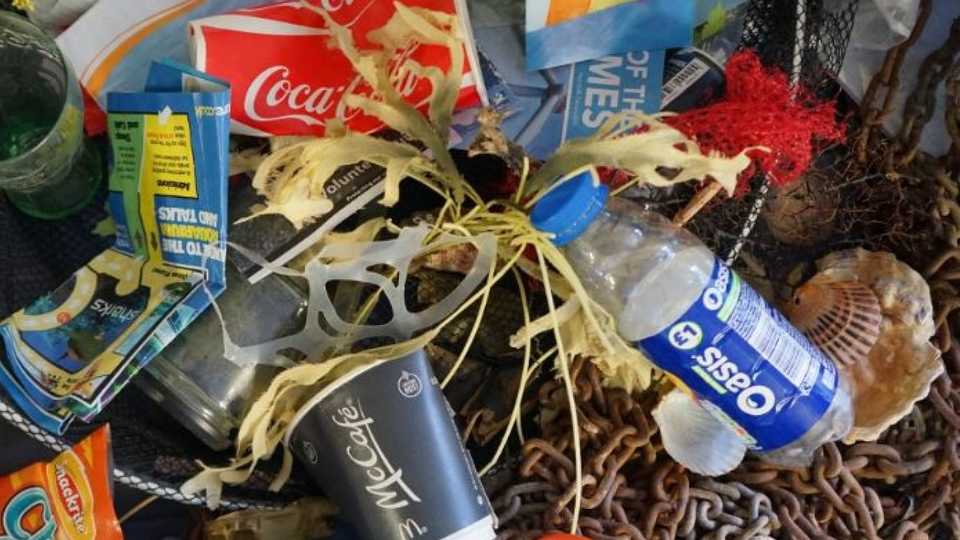
marine debris: any manufactured or processed solid waste material that enters the marine environment.
pollution: the contamination of air, water, or soil by substances that are harmful to living organisms. Pollution can occur naturally, for example through volcanic eruptions, or as the result of human activities, such as the spilling of oil or improper disposal of waste.
responsible consumerism: efforts by customers to make intentional purchase of both products and services that have minimal to no-impact harm to, or exploitation of humans, animals, or the environment. An example is the “Seafood Watch” program.
sustainable: meets the needs of the present without compromising the ability of future generations to meet their own needs
Background for Educators
Marine Debris
We face many complex challenges when it comes to a clean and healthy ocean, but one problem is simple to understand: Trash (Ocean Conservancy, 2015). Trash in the water:
- compromises the health of humans, wildlife and the livelihoods that depend on a healthy ocean
- threatens tourism and recreation, and the critical dollars they add to our local economies
- complicates shipping and transportation by causing navigation hazards
- generates steep bills for retrieval and removal.
Marine debris is everywhere—found in and around every major body of water on the planet. 80% of marine debris is due to land-based sources: litter from pedestrians, motorists, beach visitors; industrial discharges in the form of plastic pellets and powders; and garbage management issues such as ill-fitting trash can lids (California Coastal Commission, 2015).
Storm-water runoff is one of the most significant threats to ecosystems along the coastal areas of the U.S. As the water runs over and through the watershed it picks up and carries litter, contaminants and soil. The blotches of leaked motor oil on parking lots, plastic grocery bags, pesticides, fertilizers, detergents, and sediments are known as non-point source pollutants. These pollutants can be carried by runoff from rain and snow melt, and flushed into groundwater, streams, rivers and the ocean (NOAA, 2015).
Rapid Trash Assessment
The methodology for the survey was developed by the San Francisco Regional Water Quality Control Board for sections of wade-able streams, but has been adapted for assessment of trash along shorelines of lakes, beaches, or estuaries (Burres, 2009). Additionally, this activity adapts the protocol to schoolyards and neighborhoods that aren’t directly near creeks.
Conservation & Sustainability Methods
There are many potential solutions to decreasing waste that are more sustainable, which means that it meets the needs of the present without compromising the ability of future generations to meet their own needs. Students will be asked to come up with their ideas for ways to be more sustainable. This will help them build critical thinking skills. You can introduce some of these concepts to help students generate ideas.
- First “R” = Refuse: This is the most effective personal choice you can make. Refuse to buy things that are disposable such as plastic bags, single use water bottles, cheap plastic toys that break easily. People who refuse to buy certain products because there is too much packaging are practicing “responsible consumerism.”
- Second “R” = Reduce: This is more effective that reusing, or recycling. Reduce means using fewer resources in the first place. This is the most effective of the three R's and the place to begin. Before you make a purchase, think: Is this something I really need? Can I instead use something I already have? Can I borrow this item from somewhere? Can I purchased a used version from a thrift shop? If I must purchase it, how can I get it with less packaging?
- Third “R” = Reuse: Before you recycle or dispose of anything, consider whether it has life left in it. A jam jar can store leftovers. Food scraps can become compost. An old shirt can become a pajama top. An opened envelope can become a shopping list. A magazine can be shared. A dishwasher can be repaired. A computer can be upgraded. A car can be resold. A cell phone can be donated.
- Fourth “R” = Recycle: If something is broken beyond repair, or there is no other way to reuse it, then it can be recycled. Check with your local municipality to see what recycling options there are in your community. You might be surprised to see what can be recycled.
- Advocate and Vote: Many cities, such as San Francisco, have banned single use plastic bags, and foam to-go containers because of their large impacts on the Bay environment. This forces businesses to use more sustainable alternatives.
- Participate in a Coastal Clean-up Day, or Adaopt-a-Beach.
Next Generation Science Standards
The items listed below indicate how the activities supports the three dimensions of the Next Generation Science Standards:
Science & Engineering Practices
- Developing and using models
- Develop a model using an example to describe a scientific principle.
- Constructing Explanations and Designing Solutions
- 3-5: Use evidence to construct or support an explanation or design a solution to a problem.
- 3-5: Generate and compare multiple solutions to a problem based on how well they meet the criteria and constraints of the design solution.
- MS: Construct explanations and design solutions that are supported by multiple sources of evidence consistent with scientific ideas, principles, and theories.
- HS: Design, evaluate, and refine a solution to a complex real world problem, based on scientific knowledge, student-generated sources of evidence, prioritized criteria, and trade-off considerations.
Disciplinary Core Ideas
- 5-ESS3.C: Human Impacts on Earth Systems: Human activities in agriculture, industry, and everyday life have had major effects on the land, vegetation, streams, ocean, air, and even outer space. But individuals and communities are doing things to help protect Earth’s resources and environments.
- MS-ESS3.C: Human Impacts on Earth Systems: Human activities have significantly altered the biosphere, sometimes damaging or destroying natural habitats and causing the extinction of other species. But changes to Earth’s environments can have different impacts (negative and positive) for different living things.
- HS-LS4.D: Biodiversity and Humans: Human Activity is having adverse impacts on biodiversity through overpopulation, over exploitation, habitat destruction, pollution, introduction of invasive species, and climate change.
Crosscutting Concepts
- Cause and Effect
- 3-5: Cause and effect relationships are routinely identified, tested, and used to explain change.
- Influence of Science, Engineering, and Technology on Society and the Natural World
- MS: The uses of technologies and any limitations on their use are driven by individual or societal needs, desires, and values; by the findings of scientific research; and by differences in such factors as climate, natural resources, and economic conditions. Thus technology use varies from region to region and over time.
Related Performance Expectations
Remember, performance expectations are not a set of instructional or assessment tasks. They are statements of what students should be able to do after instruction. This activity or unit is just one of many that could help prepare your students to perform the following hypothetical tasks that demonstrate their understanding:
- 4-ESS2-2 Analyze and interpret data from maps to describe patterns of Earth’s features.
- 5-ESS3-1 Obtain and combine information about ways individual communities use science ideas to protect the Earth’s resources and environment.
- MS-ESS3-3 Apply scientific principles to design a method for monitoring and minimizing a human impact on the environment.
- HS-LS2-7 Design, evaluate, and refine a solution for reducing the impacts of human activities on the environment and biodiversity.
References
Burres, E. (2009). Conducting Rapid Trash Assessment. Surface Water Ambient Monitoring Program. Retrieved 3/20/2015: www.waterboards.ca.gov/water_issues/programs/swamp/docs/cwt/guidance/4311b.pdf
California Coastal Commission (2014). The Problem with Marine Debris. Retrieved March 23, 2015: http://www.coastal.ca.gov/publiced/marinedebris.html
Ocean Conservancy (2015). Fighting for Trash Free Seas. Retrieved on March 23, 2015. www.oceanconservancy.org/our-work/marine-debris/
NOAA (2015). Watersheds, Flooding and Pollution. Retrieved on March 23, 2015 www.education.noaa.gov/Freshwater/Watersheds_Flooding_and_Pollution.html
Image: Public domain, originally sourced from from https://pxhere.com/en/photo/550986
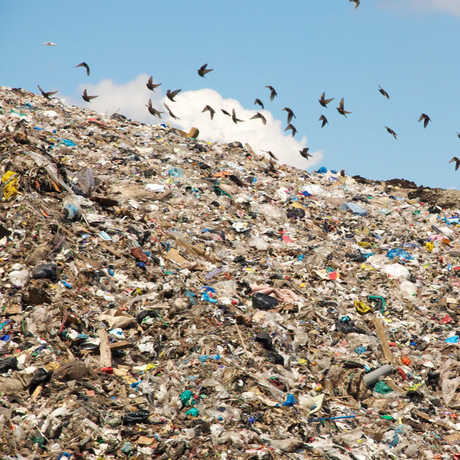
By sorting our waste into different bins, we can make a huge impact.

In this activity, students will be transformed into strategically low-impact world travelers.
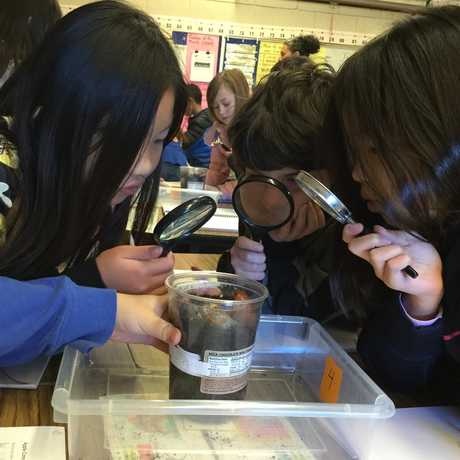
Anoushka Takla's fourth graders seek to answer the question: "What happens to our trash over time?"
Appropriate for: 4th Grade - 12th Grade
Standards for: 4th Grade, 5th Grade, 6th Grade, 7th Grade, 8th Grade, 9th Grade, 10th Grade, 11th Grade, 12th Grade
Prep Time: 15 minutes
Activity Time: 90 minutes
Subjects: Planning Investigations, Stability & Change