We're open daily! View holiday hours
Universe Update
Mapping the Cosmos
January 11, 2022
by Jacque Benitez
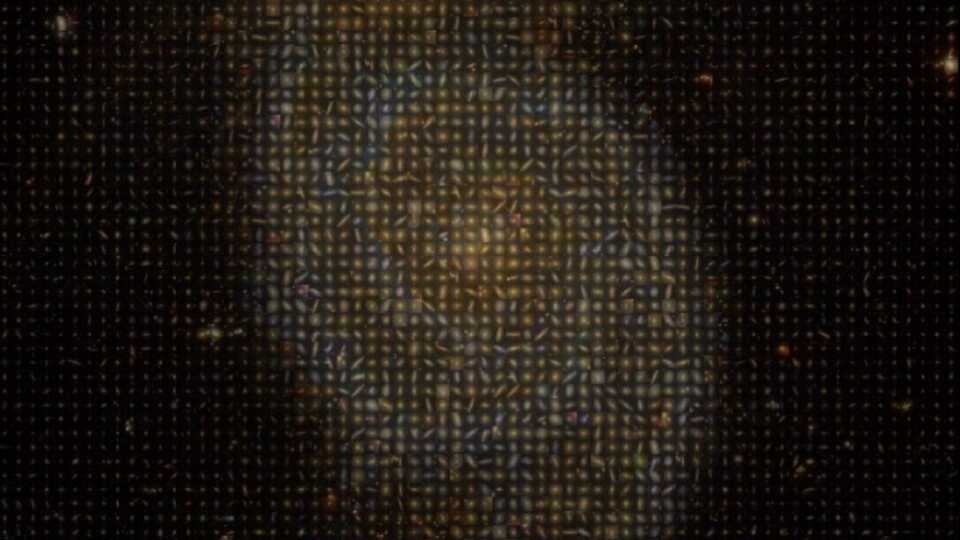
An image of the Whirlpool galaxy (M51); an iconic nearby galaxy, made using a Mosaic of images of one thousand galaxies, ten percent of the entire in the MaNGA sample. (Image courtesy Karen Masters and the SDSS collaboration.)
0
Our ancestors invented the map, which, to this day, comes in all shapes and sizes. We can now navigate our planet using just about any tool imaginable, from the tattered Thomas Guide in my grandfather’s car’s backseat to the map directly on my phone. But what about our universe?
On day two of the 239th meeting of the American Astronomical Society (AAS), astronomers shared their new additions to the map of the Universe. And they showed how robot assistants will help usher in a new era of surveying the cosmos.
The Sloan Digital Sky Survey (SDSS) has created the most detailed three-dimensional maps of the Universe ever made. Since 2000, SDSS has produced a multi-colored map of a third of our sky, gathered spectra of five million stars and galaxies, and added to our large-scale structure map of the Universe.
Today was also a celebration of the conclusion of two SDSS projects. First was the Apache Point Observatory Galactic Evolution Experiment (APOGEE-2). APOGEE-2 is the second generation of data mapping our galaxy, the Milky Way, in infrared wavelengths of light. What is unique about the infrared is that it allows astronomers to study multiple components of our galaxy, including that bulge full of densely packed stars toward the center of the Milky Way. The only problem is that the galactic disk is full of gas and dust that can block our view in the visible range of light. It also makes it difficult to spot the halo, thinly scattered stars, globular clusters of stars, and tenuous gas.
The first generation of data only covered the northern hemisphere, but APOGEE-2 was observed from both the north and southern hemispheres, giving astronomers an incredibly complete view of the Milky Way. APOGEE-2 collected spectral data for nearly one million objects. An object’s spectrum contains valuable information about its temperature, chemical composition, and, in the case of stars, intrinsic luminosity. This gave astronomers a wealth of knowledge, such as types of stars, their motion in the galaxy, and what they are made of. The data release also included the distances of objects, orbits, and if stars are part of a cluster within the Milky Way.
The second project was Mapping Nearby Galaxies at APO (MaNGA). As the title suggests, MaNGA mapped 10,000 galaxies with the Apache Point Observatory (APO). In previous maps of a galaxy, astronomers only get a handful of detailed images, typically measuring only a single spectrum for an entire galaxy. MaNGA, using innovative techniques, was able to make 10–100 spectral observations for each galaxy! Think of looking at a map of the average temperature of the entire United States versus a map of the average temperature of each state. The more detailed map will clearly show you that Arizona’s temperature is very different from New York’s.
MaNGA used these spectra to create more than 30 maps for each galaxy, detailing the age, chemical makeup, and motion of the stars inside it. These maps can help astronomers answer many different questions: How many baby stars are being formed at every position in the galaxy? How quickly is the gas moving compared to the stars? Or what is the influence of the central supermassive black hole?
MaNGA is the largest galaxy survey of its kind. Like APOGEE, maNGA’s data is publicly available, but in addition, the SDSS team has also created a specially designed tool dubbed “Marvin” to help anyone access the data. Marvin helps make a quick look at the data of each galaxy in an easy-to-use web interface and is also available as Python modules that allow anyone familiar with coding to access and visualize this complex data.
In fact, one of the greatest accomplishments of SDSS is that all of the data is available to the public, since first light in 2000. As Dr. Rachel Beaton said earlier today, “Science-ready data is at your fingertips. Come up with a question. You can pose that question and start investigating that question without having to make your own pipeline and your own development.”
So what does the future hold in mapping the Universe? After twenty-one years of observers loading heavy aluminum plates night after night, the Sloan Digital Sky Survey (SDSS) is now seeing the Universe with robotic assistance. That’s right—robots! They’ll speed up the process dramatically. The original plates had to be prepared months in advance and shipped to the observatories, but the robotic system is reconfigurable in about 15 minutes! Then, even after one of those old-style aluminum plates had been fabricated, it used to take astronomers about 30 minutes to prep each one at the telescope, but the robots can do the job in about a tenth the time. And the old plates typically observed a few thousands objects at the same time (which is pretty amazing), but the robotically-managed plates can observe 15,000 objects simultaneously!
With this new technology, SDSS-V will inaugurate three new mapping projects—the Milky Way Mapper (MWM), Local Volume Mapper (LVM), and Black Hole Mappers (BHM). Again, all the data will be available for anyone to explore. As Dr. Juna Kollmeier said, “I invite you to please join us, play in the data, connect with your inner scientist.
0
Related science news
From black holes to small galaxies, Dr. Juna Kollmeier takes us through some of the best discoveries of SDSS.